WHAT IS VALUE MOMENTUM?
VALUE
Value tells us if a stock is expensive or cheap relative to its 20 year earnings history.
MOMENTUM
Momentum highlights inflection points to provide the timing clues necessary to maximise returns by picking up changes in relative sales and profitability estimates.
PERFORMANCE
Combining these two tools reliably generates above average returns by highlighting where long term value translates into performance.
Click image for full product view
WHAT CAN VMR DO FOR YOU?
- Highlight cheap stocks where forecast momentum is improving.
- Identify stocks that are over-valued where forecast momentum is waning.
- Provide crucial timing information to pinpoint optimum entry and exit points.
- Provide a bespoke overview of a portfolio or focus list.
- Give access to our unparalleled database of 1500 cyclically adjusted ‘Trend PE’ stocks globally and momentum charts for over 5000 stocks worldwide.
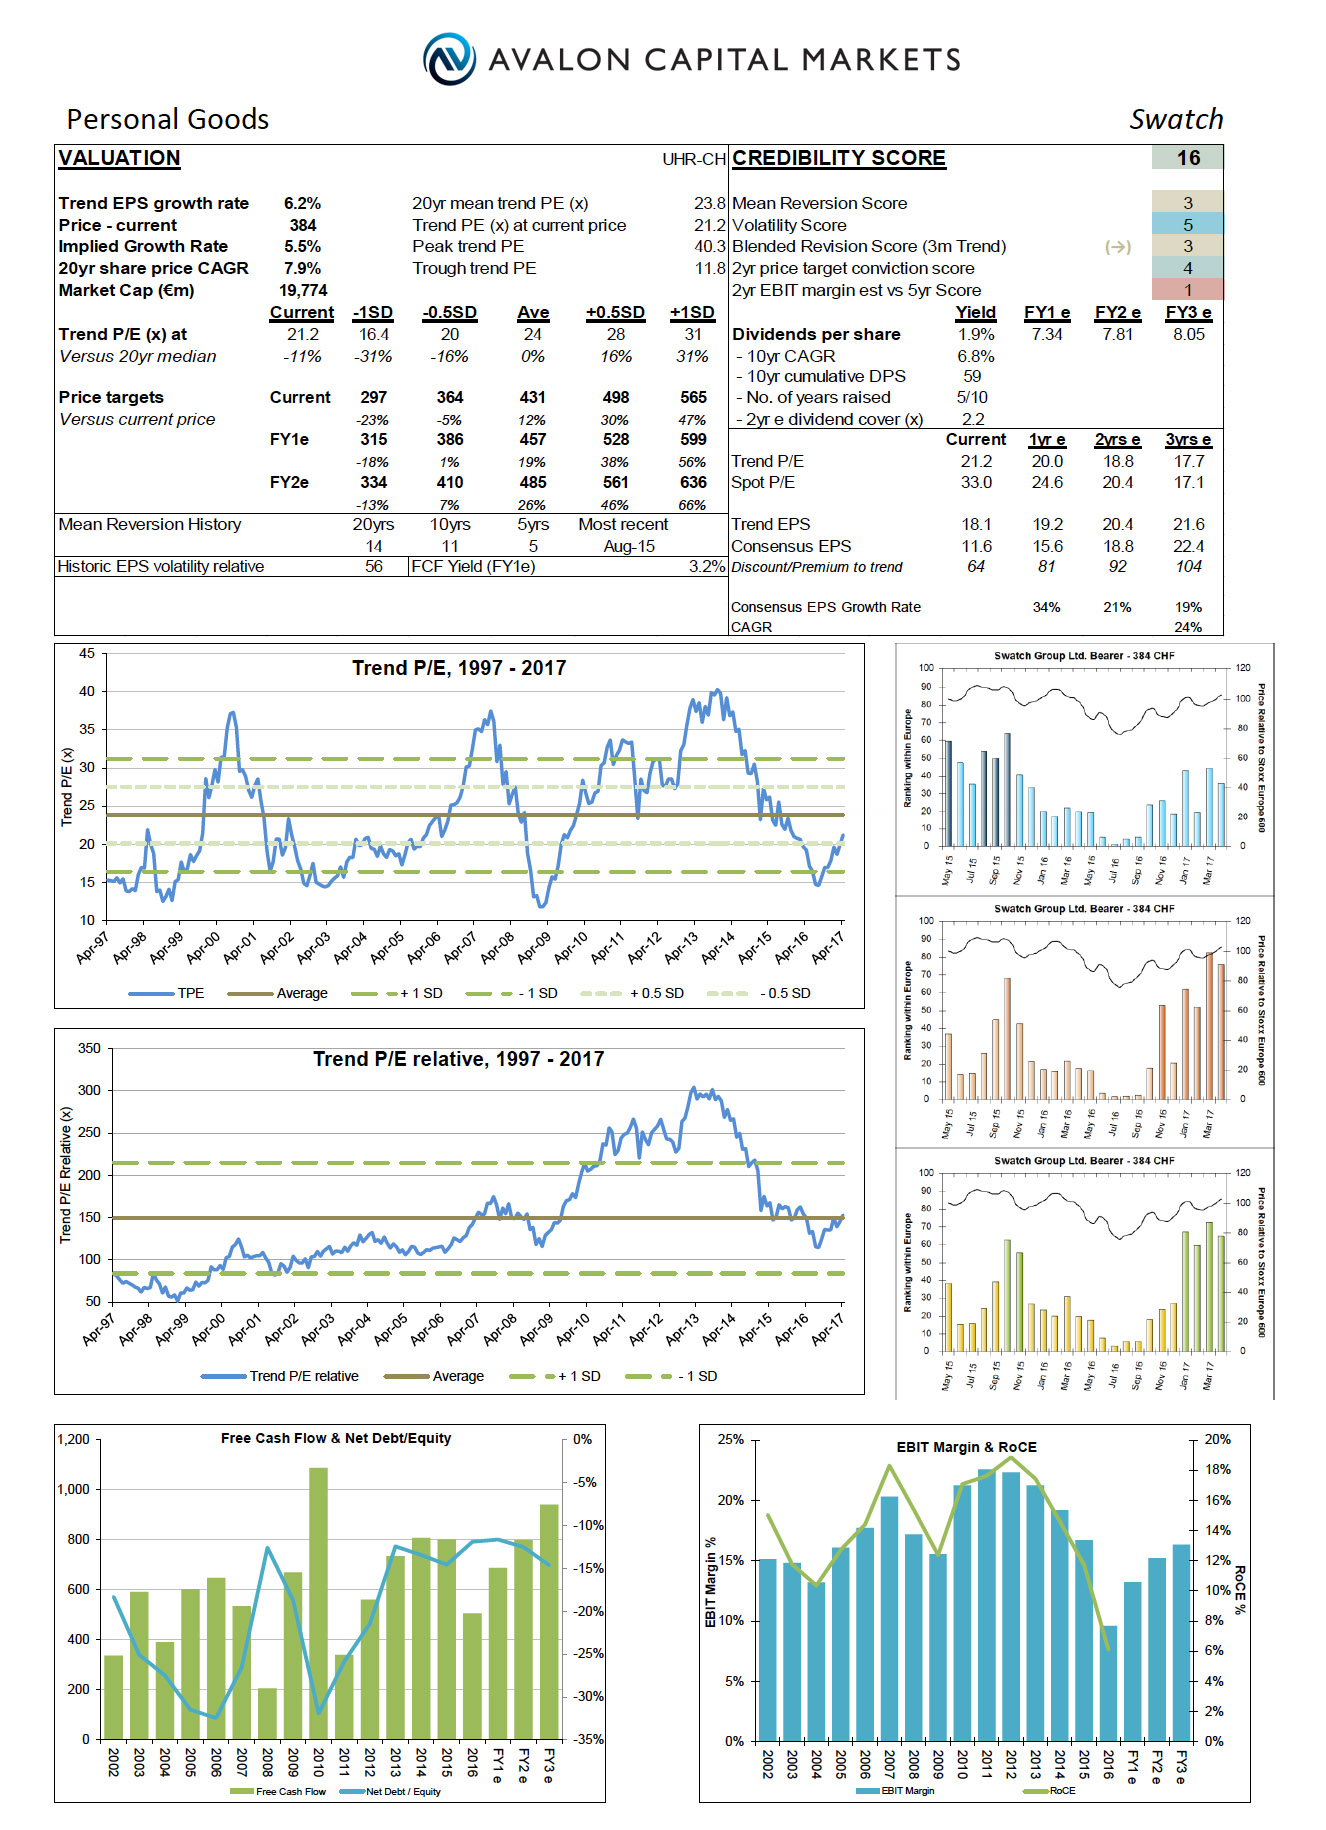
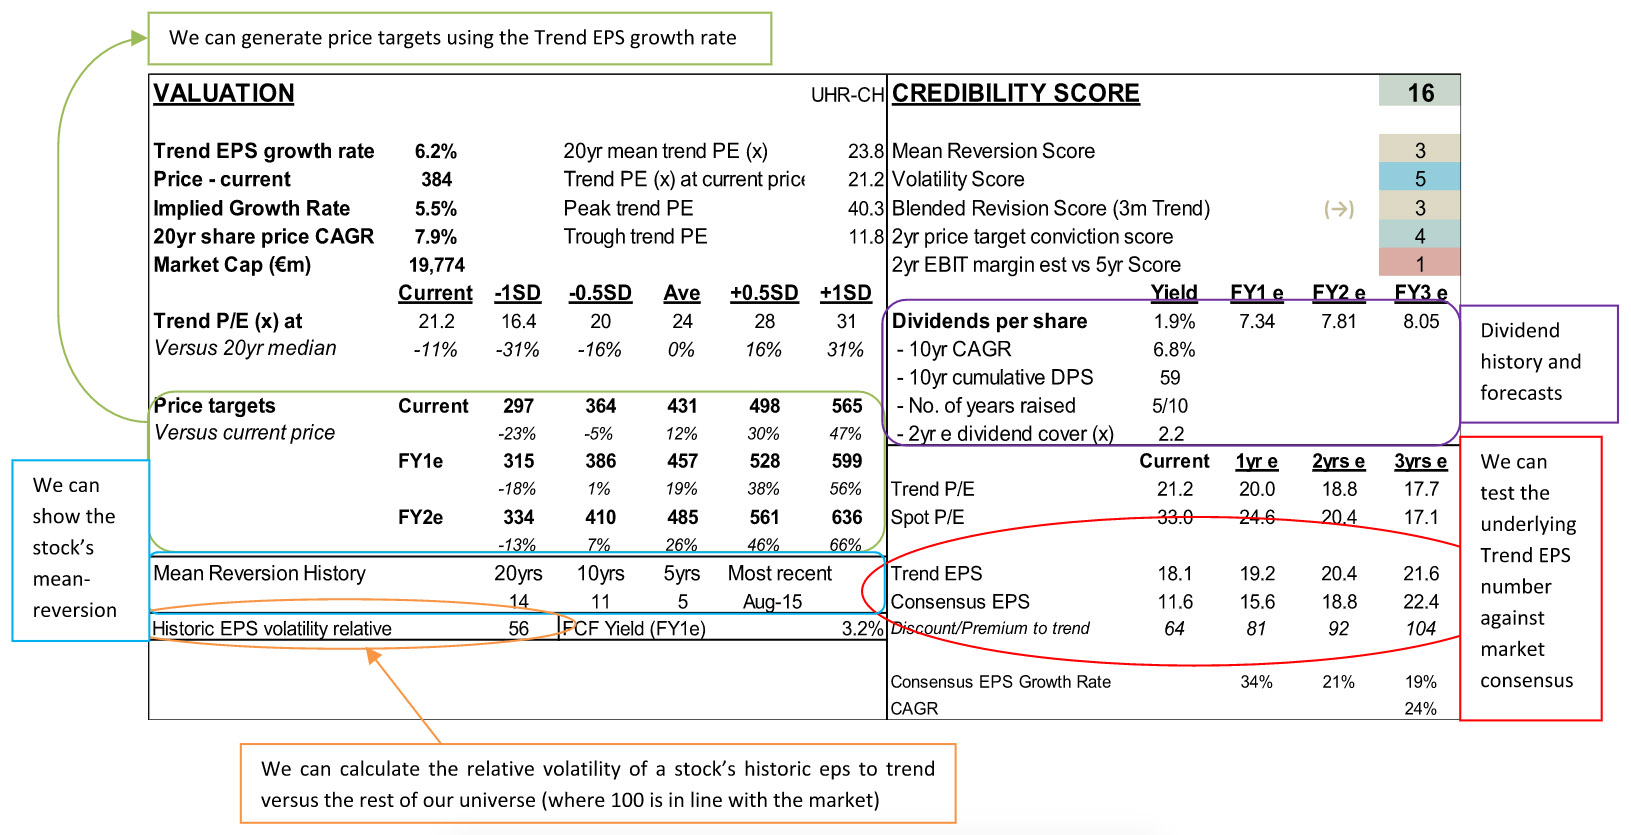
VALUATION
Valuation tells us the 20 year Trend EPS growth rate that we use to calculate the Trend P/E. We can then derive price targets and measure our Trend EPS against consensus estimates looking forward up to 3 years to highlight stocks where the growth rate is diverging from trend.
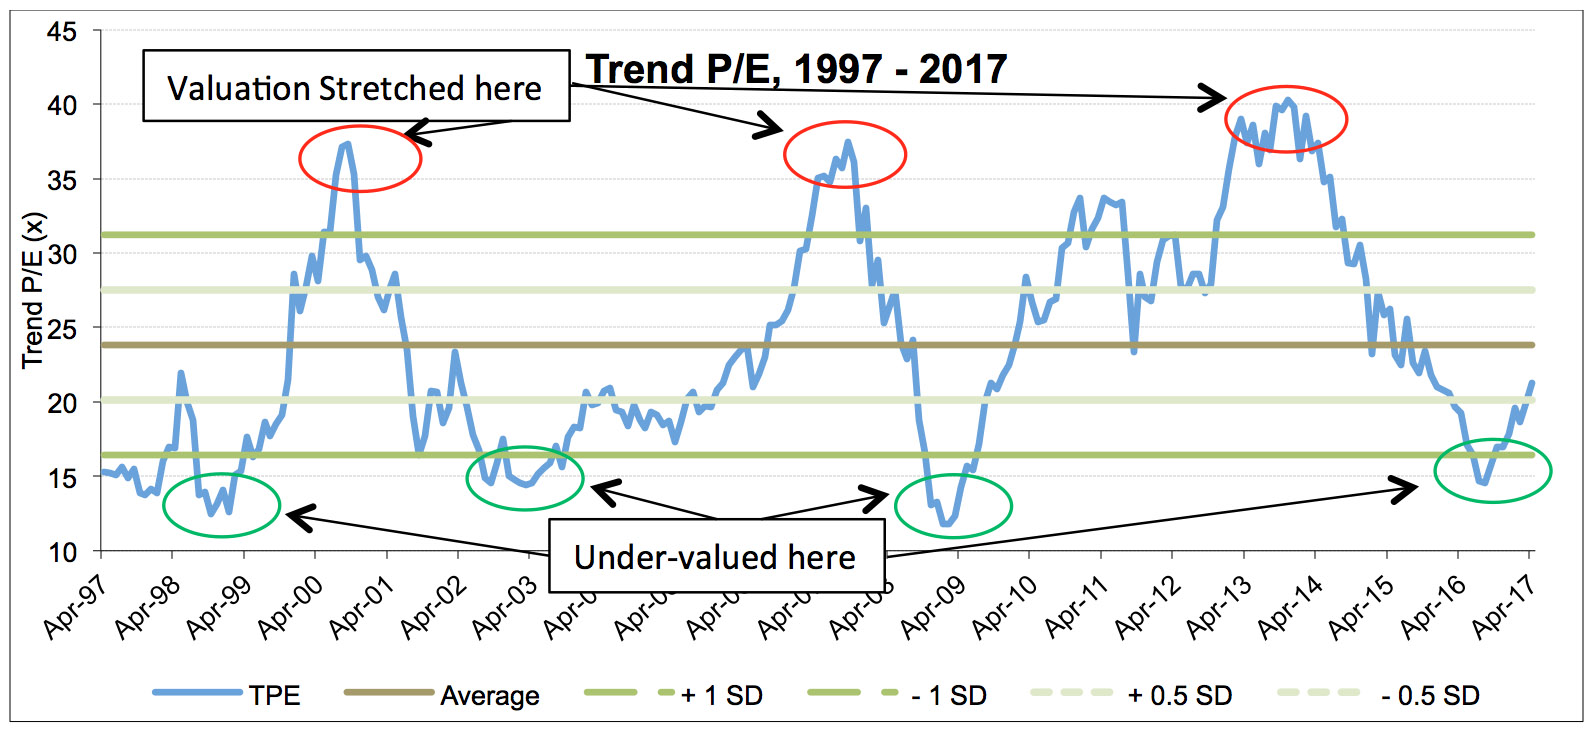
TREND P/E
The Trend P/E chart shows how disciplined the stock is relative to its standard deviation bounds.
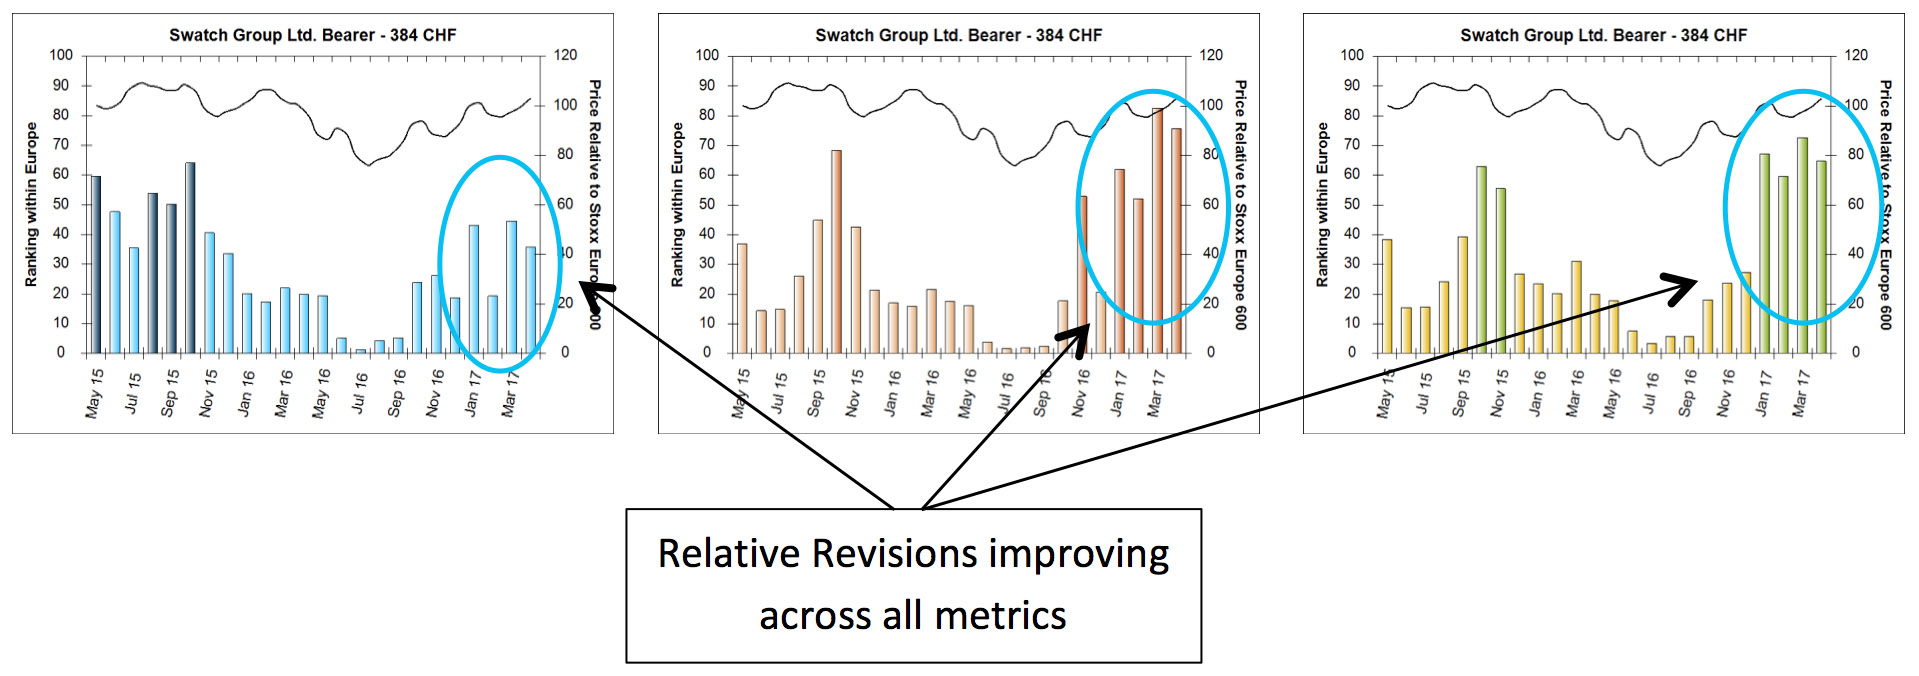
MOMENTUM
SALES, EBIT AND EPS REVISION CHARTS
- Academic and real-world evidence highlight the positive correlation between analyst estimate upgrades/downgrades and stock price performance.
- The combination of valuation and the catalyst of changes in earnings forecasts generates superior results, both on the upside and the downside.
- Bad news travels quickly, so when an over-valued stock suffers from falling earnings revisions the effect can be a rapid de-rating. Conversely good news travels slowly so it can take a long time for undervalued stocks to respond to rising revisions giving time for more in-depth analysis.
- We try to capture the full picture by monitoring Sales and EBIT revisions as well as EPS revisions with the aim of spotting and profiting from inflection points in these underlying trends.
CREDIBILITY SCORE
A five factor score with each separate score ranging from 1 (the lowest) to 5 (the highest) giving an overall score from 5 to 25. All scores are relative to the other stocks within the universe.
MEAN REVERSION SCORE
Simply how frequently the stock has mean reverted over 20, 10 and 5 years ranked against the other stocks in the universe. This stock is middle of the range.
VOLATILITY SCORE
Takes the Historic EPS volatility against Trend of each stock and ranks it against the other universe members. This stock scores a 5, meaning EPS volatility is lower than the market average.
BLENDED REVISION SCORE
An average of the height of the latest bar in each of the Revision charts (Sales, EBIT and EPS). The stock scores a 3 for average revision bars. The arrow next to this score is an indication of revision momentum. It shows where the average bar height is now compared to where it was 3 months ago. The bars have remained average over this time.
2 YEAR PRICE TARGET CONVICTION SCORE
A measure of how comfortable we are with the price target 2 years out. It is based on how often the stock mean reverts, how far away the stock is from the 20 year historic median, how close analysts’ consensus is to our Trend EPS and how large the upside/downside is. The stock scores a 4 as the 2 year price target is not unreasonable, the mean reversion is in line with the market, analysts numbers are close to our own trend and the stock is inside of its standard deviation bands.
2 YEAR EBIT MARGIN ESTIMATE VS 5 YEAR SCORE
We take the EBIT margin median of the last 5 years and compare it to the estimate 2 years out. In this case this is 18% versus 15% which scores a 1 but we are seeing margin recovery which re-assures us.
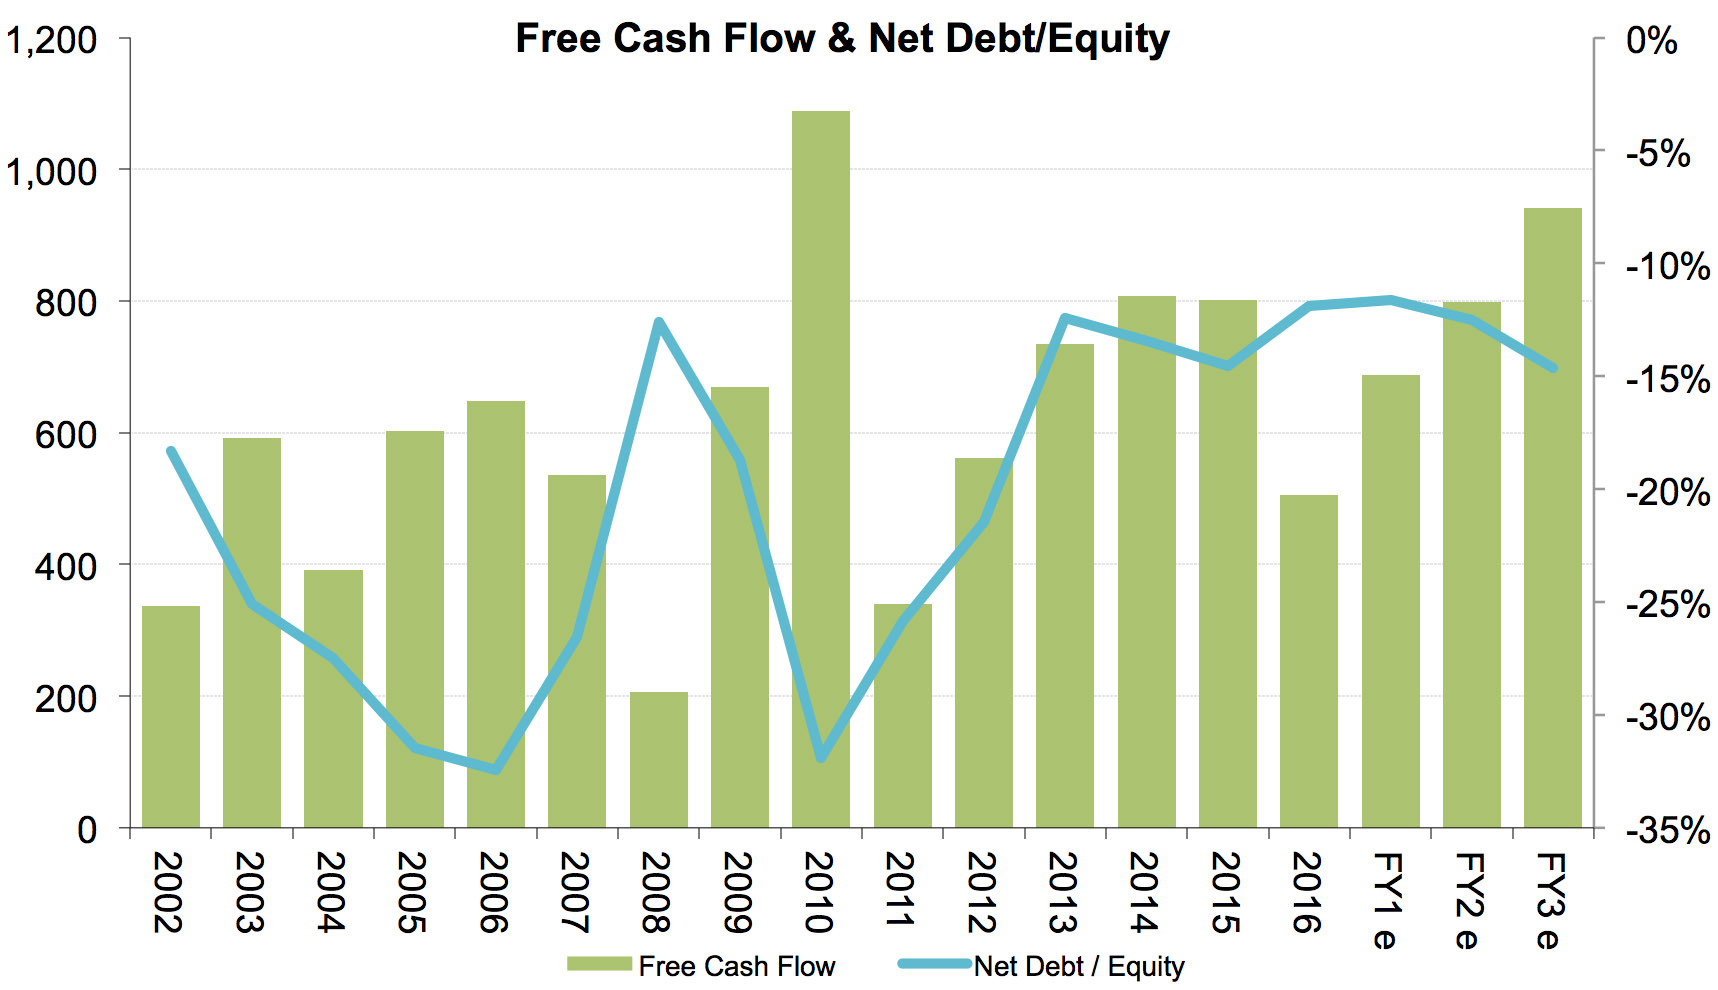
CASH FLOW
The chart shows fifteen years of reported Free cash flow and three years estimated free cash flow alongside the net debt to equity over the same time frame.
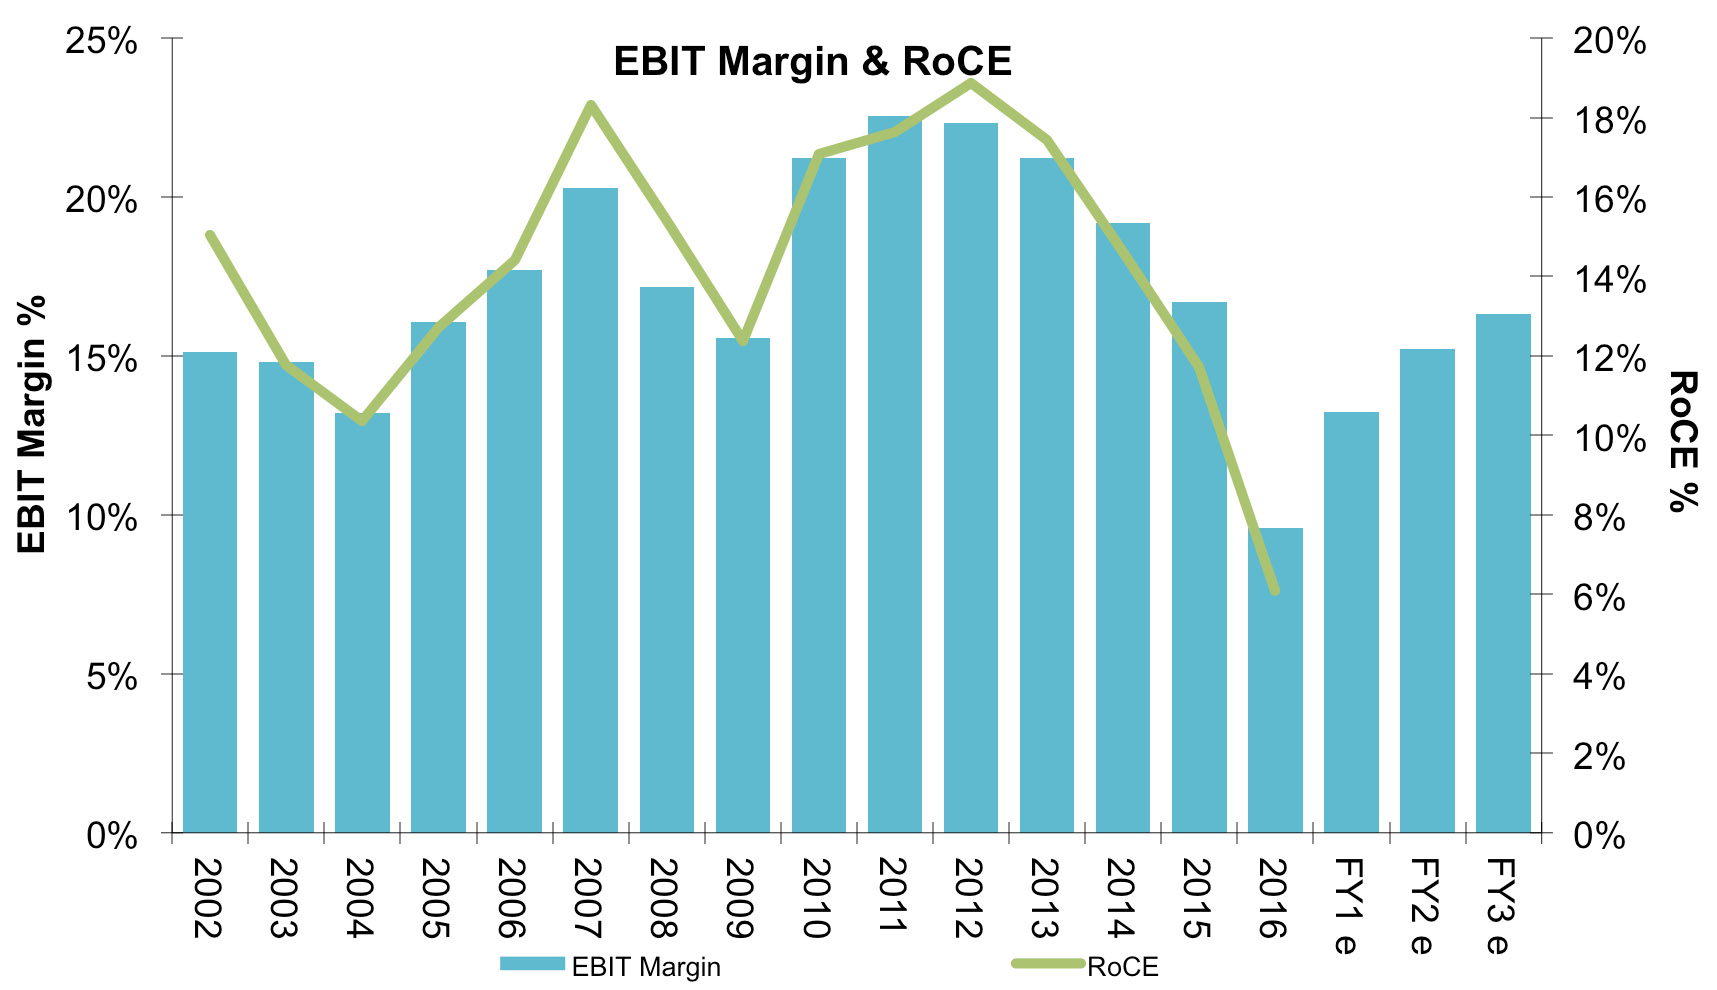
PROFITABILITY
The chart below shows fifteen years of reported EBIT margin and three years estimated EBIT margin alongside the Return on Capital Employed over the same time frame.
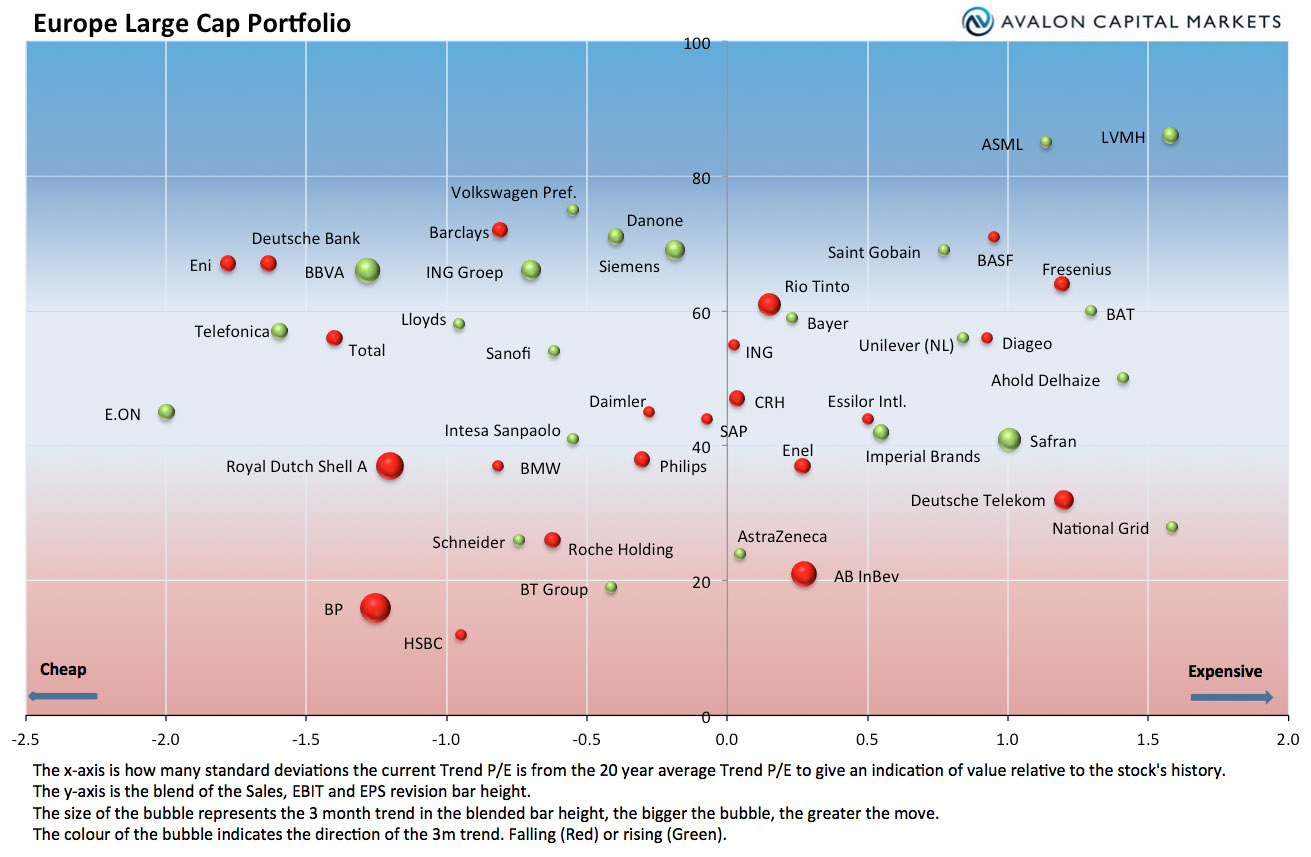
PERSONALISED OVERVIEW
Combining our tools into a personalised bubble chart gives our clients an at-a-glance overview of where a stock sits in terms of its value and shows the market consensus of its relative estimates.
OTHER PRODUCTS
- Weekly updates to our thematic baskets and valuation spreadsheets
- Fortnightly updates to our global momentum products including screening and intra-sector analysis
- Online database
- Monthly updates to our individual stock profiles combining valuation and momentum
- For clients who require greater interaction we offer calls, meetings and bespoke products.